Business Case Templates
Please note that this content is under development and is not ready for implementation. This status message will be updated as content development progresses.
The decision to implement UNTP needs a positive business case to justify the investment. The purpose of this page is to provide a framework for business case development. We provide a generalised cost / benefit model and then discuss it's application to specific roles and industries. We also provide a separate cost benefit model and business case template for regulators.
Industry Cost Benefit Model
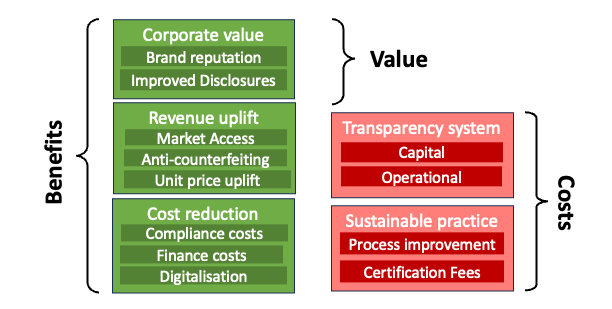
The high level model shown below breaks benefits into three categories and costs into two categories.
- Benefits accrue through increasing revenue and/or decreasing cost. Improved margins that result from that of course contribute to corporate value but there are also less tangible benefits at the corporate level such as brand reputation.
- Costs are incured through changes to production processes to acheive greater sustainability and the implementation of traceability & transparency systems to communicate that verifiable sustainabilty.

Actual benchmarks for benefits and costs by industry sector and goegraphic region will become increasingly available over time through the UNTP Value Assessment Framework (VAF). At this point in time, benefits and costs are described qualitatively and supported with metrics from public research.
Benefits - Revenue Uplift
Market Access
Legislation increasingly requires companies to prove ESG credentials to be able to trade in certain countries. Some example include the EU Deforestation Regulation EUDR as well as several due-diligence regulations such as the EU CSDDD and US UFLPA. Legislation effectively put pressure for on buyers to prove provenance and sustainability requirements for certain products, as well as a higher burden of truth from suppliers from to certain regions. In many cases, these regulations reverse the burden of proof - namely that companies must prove that they are compliant in order to maintain market access. UNTP based transparency allows companies to keep trading in said areas, rewarding suppliers ensuring good practices rather than being forced outright out of these markets.
- Quantification. The percentage of revenue that is either retained or increased will depend on the commodity and footprint of any given supplier in a regulated market. The value of imported goods impacted bu EUDR is approximately $400Bn which is around 1.2% of world trade. The volume of trade impacted by Due Diligence acts is similar or larger than EUDR.
- References. EU market import volumes, Krungsri EUDR impact analysis,
The impact of these trade barriers for any given company will be between 0% and 100% of revenue depending on which commodities they sell to which market. But given the collective impact of between 2% and 3% of world trade, an average benchamrk of 1% of revenue seems conservative.
Unit Price Uplift
Consumers are increasingly selective about product choice based on believable sustainability criteria. There are several surveys that indicate around two-thirds of consumers consider sustainability in product choices and that around one third are willing to pay a premimum. The amount of the price premium veries widely and there is evidence that consumer behaviour change is slow and sometimes only temprorary. There is also evidence that rich data (for example UNTP DPPs) drives stronger behaviour. The amount of end product price increase that flows through to the upstream supply chain is more difficult to quantify but may be very limited. Nevertheless, if buyers select supply based on sustainability criteria then non-conforming suppliers and products are likely to be forced into lower-priced commodity markets.
- Quantification Estimates of the average sustainability premium that consumers will pay vary widely from around 1% to 12%. If 30% of consumers are willing to pay a 5% premium then the overall unit price impact is around 1.5%.
- References. Consumer high estimates, Consumer low estimates.
The unit price uplift for verifiably sustainable goods will vary widely depending on commodity and market. However an average benchmark of 1% seems reasonable and conservative.
Anti-Counterfeiting
Global trade in counterfeit goods is estimated at between 2% and 5% of trade. The most impacted commodites are pharmaceuticals and luxury goods including quality wines & spirits. The volumes increase when pirated / smuggled goods are taken into account including illicit tabacco into high tax markets. What is more difficult to quantify is the proportion of conterfeit goods that are un-knowlingly purchased as genuine goods since, in many cases, buyers of fake luxury goods or illicit tobacco make purchases knowing that the goods are fake or pirated. UNTP offers a simple but effective anti-counterfeit protocol that works well when buyers are motivated to confirm that goods are genuine.
- Quantification. 4% of global trade represents about $1.2Tn in counterfeit goods. If approximately 50% of that trade can be impacted by improved anti-counterfeiting measures then the average value is around 2%. If the effectiveness of anti-counterfeiting mesaures is estimated at 50% then the value falls to around 1% of trade.
- References. OECD trends in counterfiet goods, USTPO counterfeit estimates.
The value of sales recovered by reductions in illicit goods will very from 0% for commodity goods to as much as 10% for pharmaceuticals and some luxury goods. A benchmark value of 1% industry-wide seems reasonable and conservative.
Benefits - Cost Reduction
Compliance Costs
Regulatory compliance costs include the administrative burden of reporting, processing fees, tariffs, border clearance delays, and penalties. As sustainability regulations increase, these will increasingly be enforced at the border and will most likely result in higher compliance costs. UNTP offers customs authorites corporate regulators higher confidence data that can be used to streamline border processing, reducing administrative costs and the likelihood of delays. As countries proceed at different rates towards net zero commitments and have different domestic carbon prices, it becomes increasingly likely that more countries will impose carbon border tariffs such as the planned EU CBAM. High quality evidence of low carbon foortprint via UNTP DPPs together with full traceability can help companies prove origin and value add across different steps of the prodution process and value chain, and thus reduce the burden of proof to profit from preferential tariff treatment. Finally, high quality evidence of conformance of imported goods reduces the risk of punitive non-compliance fines.
- Quantification.
- References.
Finance Costs
UNTP provides a framework based on international standards which can accommodate different ESG risks, enabling development banks to standardize their reporting and ensuring their mandate, without having to create ad-hoc structures for each Sustainable Supply Chain Finance Deal. This unlocks a significant trade finance gap, and enables preferential finance to reach deep-tier suppliers. Access to lower financing costs for suppliers results in lower cost of good sold and improved margins. These trade finance arrangements often come with grants that can support costs associated with the ESG transition, such as support certification, consulting or implementation of new ERP systems for reporting.
- Quantification.
- References.
Digitalisation Efficiency
- Quantification.
- References.
Benefits - Corporate Value
Brand Reputation
- Quantification.
- References.
Improved Disclosures

- Quantification.
- References.
Costs - Sustainable Practices
Process Improvement
- Quantification.
- References.
Audits & Certification
- Quantification.
- References.
Costs - Transparency System
Capital investment
- Quantification.
- References.
Operational costs
- Quantification.
- References.
Industry Business Case Tempalate
Regulator Cost Benefit Model
TBD - insert model diagram here